Here an example: SunCalc at the hardkontt Roman Fort

Summer solstice

Winter solstice
More at:
http://www.foxnews.com/science/2015/01/07/let-in-light-ancient-roman-fort-designed-for-celestial-show/


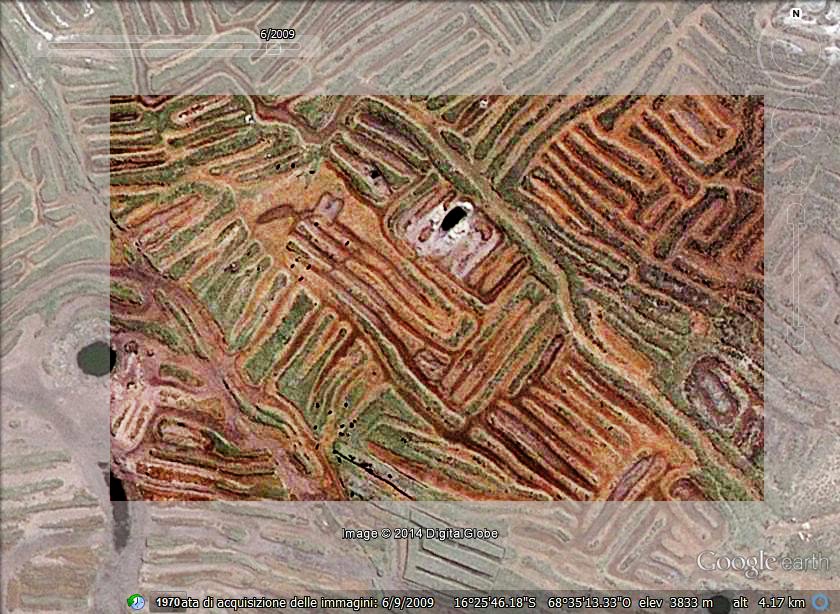
| A.C. Sparavigna, R. Marazzato (2011) Using Geographic Information Systems to Increment the Knowledge of Cultural Landscapes. In: Smart Tech & Smart Innovation, La strada per costruire il futuro, Torino, 15-17 Novembre 2011. | ![[img]](https://lh3.googleusercontent.com/blogger_img_proxy/AEn0k_u2a4hXNfsYAzyNgPyI3n__dl84e5aqHMjDsXv-KAvIjPNeEYscVEfpvxIUpYrwc7bn_7FP_CrJi0dXFedFrk_aMGEvj8sELdaYmEXRJfONPWokP6mXhAJK1wIK_iiGYc53VC_g-KK_-4es1UBPQHySWd__6AVz8xEYfHguLbKMPMx039ntT7baq28Syjc80L2MhBE4UOiDtuQQbOxTiKz6wrKcsAYoiD9TgYZo-Qjcbi6L6STBkjVE=s0-d) ![[img]](https://lh3.googleusercontent.com/blogger_img_proxy/AEn0k_uRrw1uOhyIZ8OcaFEuQx8pmqfYhjRGheL7rH4fX2_OgJHEAQcCiyLmnj0zWvYbh9sTZfQPPRn_wG5jBAEiTrEa_qTn_KZEAbP2B2dygLqXoWn-68koDAmpN-K_jYsU3XKQ6hS5Uw8tNHnT7vrC9eOrj5OafWLLd1tfRtTv8yat4KNJOQ=s0-d) | |
|


| A.C. Sparavigna, R. Marazzato (2011) Using Geographic Information Systems to Increment the Knowledge of Cultural Landscapes. In: Smart Tech & Smart Innovation, La strada per costruire il futuro, Torino, 15-17 Novembre 2011. | | ||
|
![[img]](https://lh3.googleusercontent.com/blogger_img_proxy/AEn0k_sAZ6PgcbdgHpYraEzvL--OEYC7fzXKfHbWnZg94UNU8tnVsiYzUpwj0eihAWIbMxTJLOm9B2e2xEvMTsB_1Rkp52U8V9xzNcIjmc6P6I5Q7bS5xmj9mMztSfmJc2ZfM7BkzmVzzQOsu5x5dc8hv8Hf80hAqwnL7P_-6mBSjw8SyitgA8BYYIHYnL_lK30Me-AVRndo1ieNKycfHWyU3Nq9Ns7Qiu8Cumd9-KyL8s_XtTqLQzjpeW3jrbO1kiJGjP0=s0-d)
![[img]](https://lh3.googleusercontent.com/blogger_img_proxy/AEn0k_uxpb_HzkTHkIrnx-agVye45wrXYgicB0isDjUjPLHH7Ll7HdVFQHU37naKGqh7nNCXK5ZD8f9mEnKKcyHBQN0l5Vf5GXQDaYVQhI4Kt2hOD7soMQ5Mrfzv2YIT9cFNNSC7ZzNF-18h2FfXKwpaMmsugWx8oCaPra7GdiNIatsXIFGPp-4J6OUsHA9DiazrneNpTOrxqhCcwsLQBJCfDiMrpk1Q_laGE-gxgOUjoV2S_mI6ufZaahr-_nh3GV-olCHH2GXrPiWdlFvvh6KFBwnZLzjmbNqHJrA=s0-d)